
Conversion Rate Optimization Audit: A Step-by-Step Guide
Run a conversion rate optimization audit on your ecommerce store: funnel analysis, PDP and checkout checks, metrics, prioritized fixes and a testing plan.
You've got traffic, you've got orders, and you still don't know where the money's leaking. Paid sessions land on product pages and vanish. Mobile converts at a fraction of desktop, but nobody can show you which step breaks. A recent theme change or migration made conversion move, and you're not sure if shoppers changed or your tracking did.
That's the job of a conversion rate optimization audit. Not a list of forty tactics, and not a homepage redesign. It's a disciplined check of the funnel, the pages inside it, and the measurement system underneath, so you fix the largest loss first and you can prove the fix worked.
I would start where shoppers already intend to buy, work backward only as far as the data requires, and refuse to rank any fix until the numbers behind it reconcile.
Table of Contents
- Where Your Store Loses Shoppers First
- How to Run the Audit in Six Phases
- Confirming Your Analytics Can Support Decisions
- Page-Level Checks for Product, Category and Checkout Pages
- Mobile and Accessibility Problems That Cost Sales
- Prioritize Fixes and Validate Them
<a id="where-your-store-loses-shoppers-first"></a>
Where Your Store Loses Shoppers First
A store can show a healthy overall conversion rate while one high-traffic path loses buyers at a specific step. Start with the funnel, then break the results down enough to see where the loss concentrates.
Map the last 90 days in order: session, landing or category view, product view, add to cart, checkout start, payment, confirmed order. Record the count and step-to-step rate for each stage. Compare segments with your own 90-day baseline. Cross-industry conversion medians vary too widely by intent, price, and traffic mix to diagnose a single store.
<a id="building-a-one-page-leak-map"></a>
Building a One Page Leak Map
Split each stage by device, channel, and new versus returning shoppers. A blended rate can hide a mobile checkout problem or a product page that performs poorly for paid social but well for email. Check the segment before deciding the template is the cause.
Your one-page leak map needs four columns: stage, drop size, estimated monthly revenue at stake, and the question you still need to answer. Estimate revenue as sessions lost at that stage multiplied by average order value and your baseline purchase rate. Treat the result as a ranking aid, not a forecast.
| Funnel stage | Metric to measure | Reference value | How to read it |
|---|---|---|---|
| Landing and category pages | Session conversion rate | Your own 90-day baseline | Compare by channel, not only in total |
| Cart | Cart to checkout start rate | Your own 90-day baseline | A low rate points to shipping or cost disclosure |
| Checkout | Overall cart abandonment | About 70.19% average (Baymard, 14 years) | Track abandonment at each checkout step separately |
| Checkout form | Visible form elements per checkout | 23.48 U.S. default average vs 12 to 14 ideal | Count every field, including optional ones |
| Checkout performance | Share of sites rated good | 2% good, 65% mediocre or worse | Rate your checkout on the same scale |
Form length is only one possible source of friction. Baymard reports that 17% of U.S. online shoppers abandoned an order in the previous three months because checkout was too long or complicated. Inventory each field, step, error state, payment option, shipping disclosure, and account requirement. Then compare those details with checkout starts and completions to see where a specific problem aligns with shopper loss.
Rank the two or three stages with the largest absolute shopper loss and clearest revenue at stake. If organic landing pages are among them, include SEO risk in the review. The Shopify SEO complete guide covers technical checks to consider before changing templates that attract organic traffic.
Practical rule: Rank leaks by shoppers lost per month, not by the scariest percentage. A small percentage on your highest-traffic template can cost more.
<a id="how-to-run-the-audit-in-six-phases"></a>
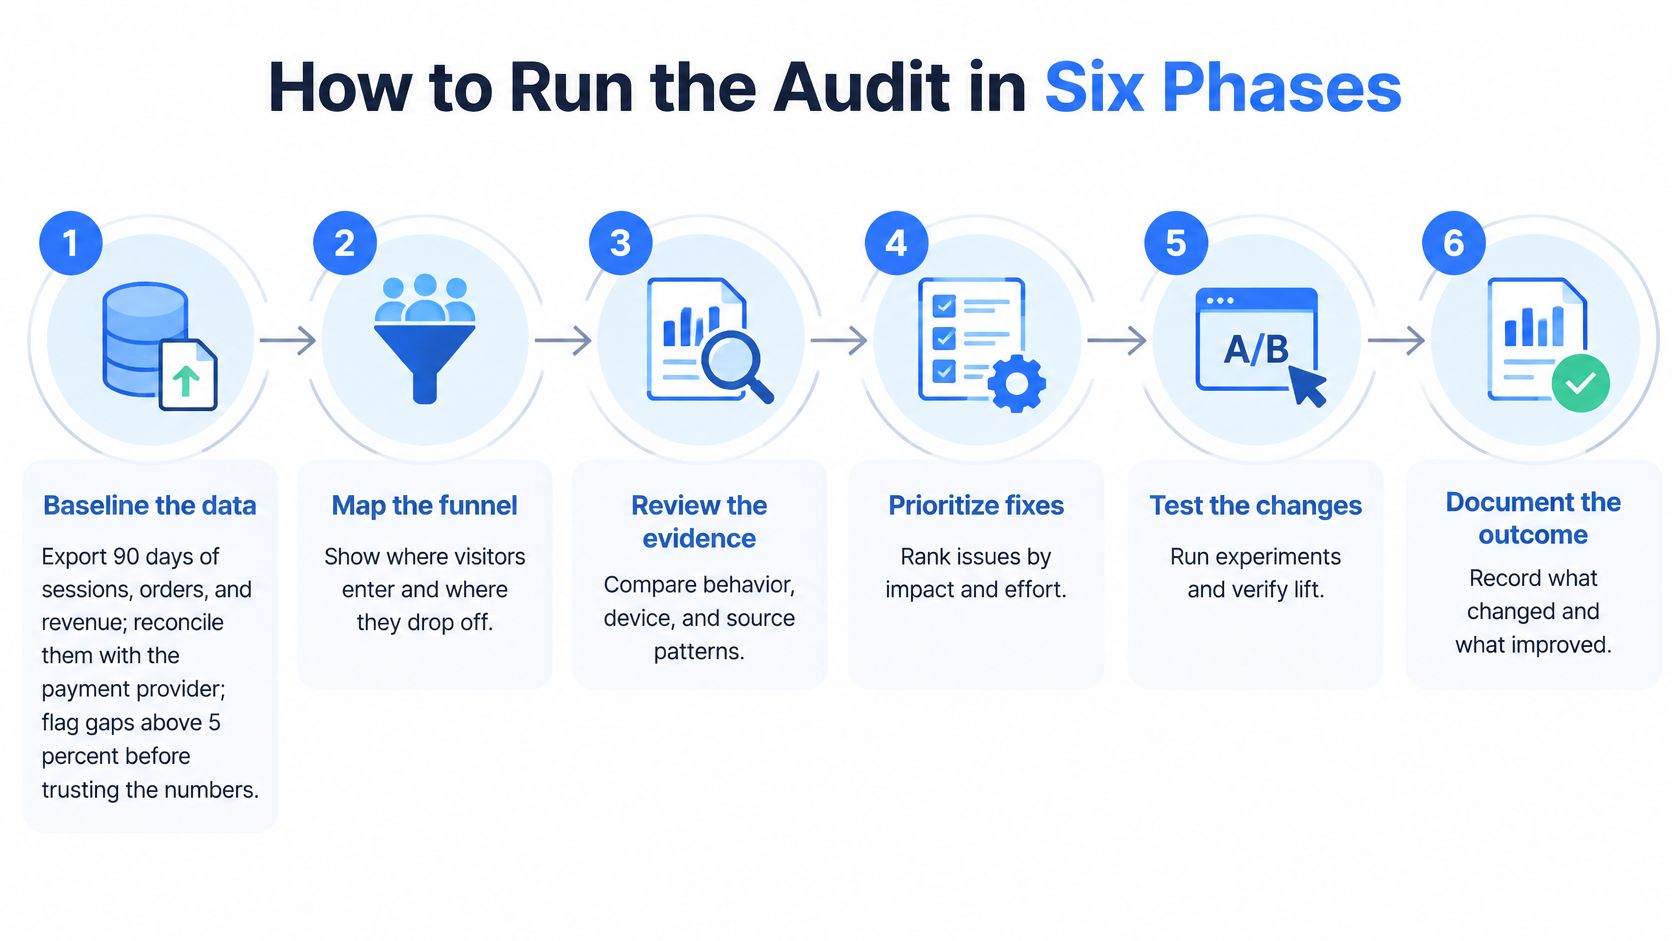
How to Run the Audit in Six Phases
Run the phases in order. If you review pages before you trust the baseline, you'll spend development time fixing a reporting artifact. If you test before you watch shoppers struggle, you'll test guesses.
<a id="phases-one-to-three"></a>
Phases One to Three
Baseline the data: Export 90 days of sessions, orders, and revenue from analytics and reconcile orders against your payment provider export. Flag any gap above 5% and stop there until you understand it. Output is a baseline sheet segmented by device, channel, template, and customer type.
Map the funnel: Turn the baseline into the leak map and mark each stage healthy, suspicious, or broken. Healthy means the segmented rates hold up. Suspicious means one segment diverges sharply. Broken means shoppers can't complete a required action. Output is two or three priority paths, not ten.
Review each key page type: Score product, category, cart, and checkout templates pass or fail against a written checklist. Don't write opinions like "feels cluttered." Write the element, the device, and the failed pass signal. Output is a scored template list ready for shopper testing.
Skipping reconciliation is the most expensive shortcut in the whole audit. Every ratio after it, add to cart rate, checkout completion, revenue per session, inherits the error.
<a id="phases-four-to-six"></a>
Phases Four to Six
Run five moderated usability sessions: Ask shoppers who match your buyers to find and buy one real product on their own phone where possible. The Nielsen Norman Group guidance on how many test users you need states that testing with 5 users typically uncovers about 80% of site-level usability problems. Use those sessions to find failures, not to estimate a conversion rate. Record where people hesitate, misread validation, tap non interactive elements, or abandon a field.
Log every finding in one sheet: Give each issue one row with evidence, screenshot or recording timestamp, metric affected, page, device, and segment. Merge duplicates ruthlessly. If three findings describe the same sticky button covering a field, that's one fix with three pieces of evidence, which raises confidence.
Prioritize and validate: Score each fix, then ship it as an A/B test or staged release through your testing or feature flag platform. Set a monitoring window before launch and decide in advance what result keeps, reverts, or extends the change. Output is a ranked backlog with owners and decision dates.
Use the right tool for each phase and no more. Analytics exports and funnel reports for the baseline, payment provider exports for reconciliation, a session recorder like Microsoft Clarity or Hotjar for behaviour on the priority path, a spreadsheet as the single findings log, and your testing platform for release. Extra tools don't compensate for an undefined pass signal.
Five users won't tell you what your conversion rate will become. They will show you, quickly and cheaply, why motivated shoppers can't finish tasks you thought were obvious.
A finished audit file should stand on its own. It contains the reconciled baseline, leak map, page scorecards, session evidence, findings log, scores, and validation plan. A developer or stakeholder should be able to pick it up without a follow up call and know what to build, why it ranks there, and how success will be judged.
Testing only on desktop is the other common failure. If your moderated sessions, recordings, and QA all happen on a large monitor, you'll certify a checkout that your phone shoppers can't use with one thumb.
<a id="confirming-your-analytics-can-support-decisions"></a>
Confirming Your Analytics Can Support Decisions
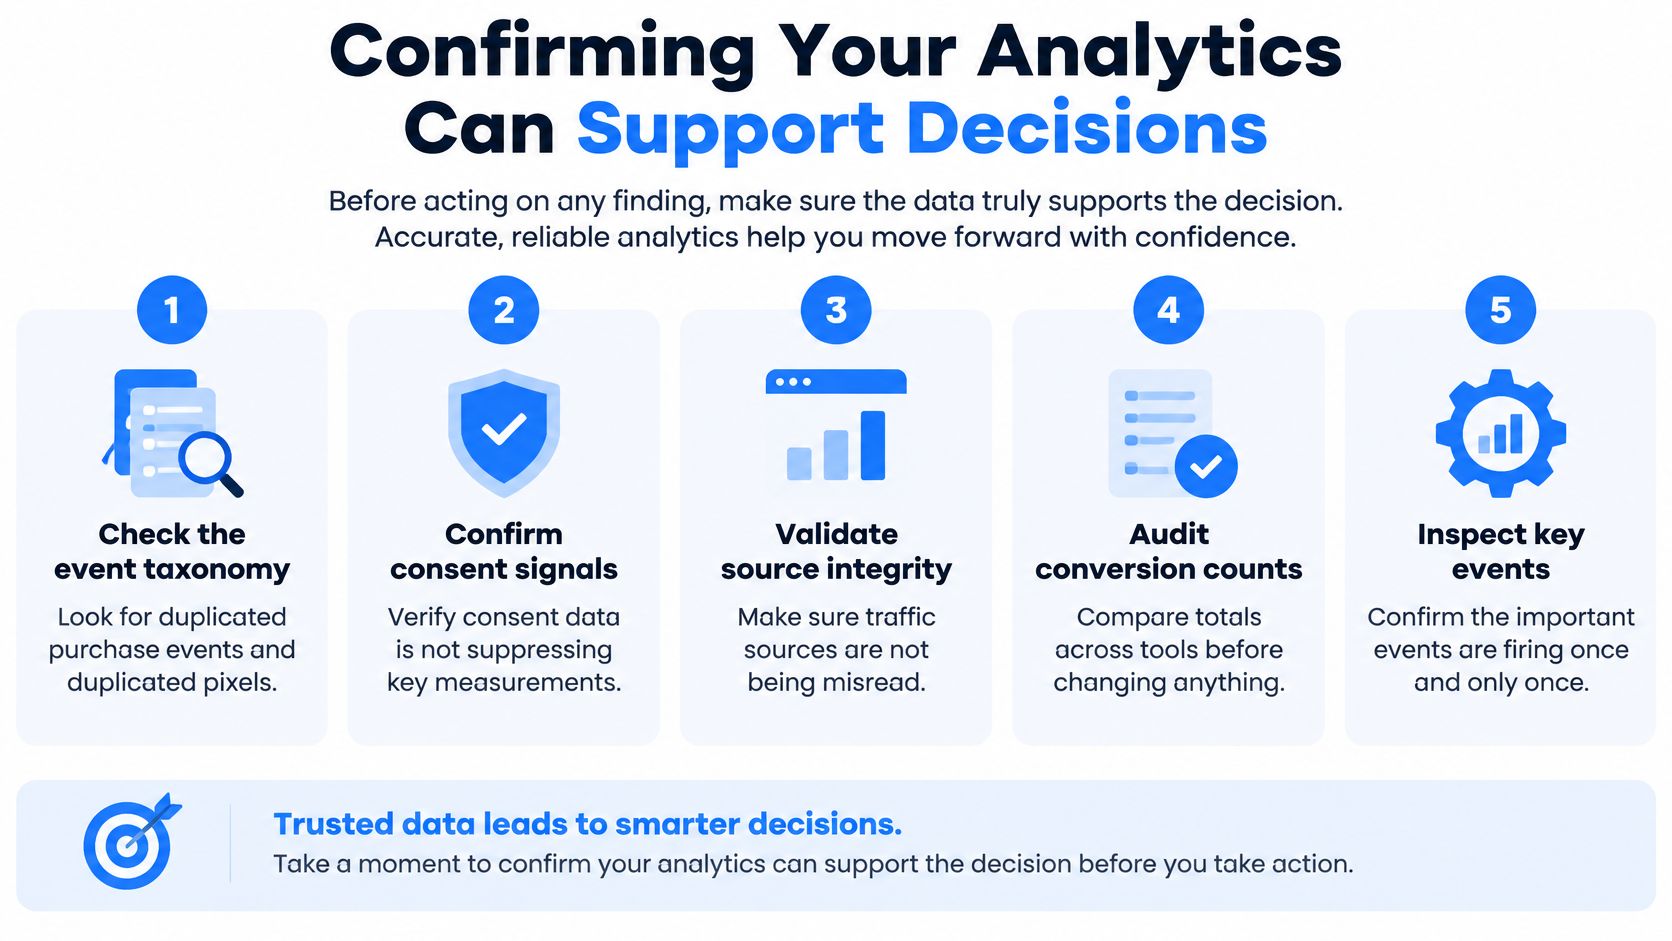
Sometimes the most valuable audit finding is do not test yet. If purchase events fire twice, consent settings drop orders from one country, or a migration renamed your checkout events, you can't tell a real lift from an instrumentation artifact. Acting anyway doesn't make you decisive. It makes the next quarter unreadable.
<a id="the-checks-that-block-bad-decisions"></a>
The Checks That Block Bad Decisions
- Event taxonomy: Place test orders and confirm view, add to cart, checkout start, and purchase each fire once, with matching order IDs and values.
- Pixels and consent: Check for duplicated pixels in theme code, tag manager, and channel apps, then confirm consent signals don't suppress purchases unevenly by market or device.
- Reconciliation: Compare analytics orders with store orders and payment records weekly. Treat a gap above 5% as a blocker for ranking fixes.
- Sample ratio mismatch: On any live test, run the testing platform's mismatch check before reading results. A broken split invalidates the headline result.
- Attribution continuity: After a URL or platform change, confirm historical campaign and landing page reporting still maps to the new templates.
Then define one primary business outcome. I prefer net revenue or contribution margin per session over clicks or add to cart rate, because a change can win clicks and lose money. Add guardrails beside it, refund rate, cancellation rate, discount share, and margin, so a conversion gain can't hide a quality problem.
Set a delayed conversion window that matches how your shoppers buy. A considered purchase judged after a short window punishes channels that start longer journeys. Compare seasonally sensitive periods year over year as well as against the prior weeks, and note promotions, stockouts, and price changes in the audit file beside the data they affect.
Blocker test: If you can't reconcile orders across analytics, the store, and payments, you don't have a conversion problem you can measure yet.
Lower your expectations for test win rates. The Octo Agency summary of A/B testing statistics notes that only about 12% of experiments in a large Optimizely dataset produced a statistically significant improvement on the primary metric. That's not an argument against testing. It's an argument for stronger hypotheses, adequate sample sizes, and separating statistical significance from an effect large enough to matter commercially.
Score the setup before you proceed. Give the audit a measurement confidence score with pass or fail rules for taxonomy, reconciliation, consent, attribution, and test integrity. Fixes that are obvious breakages, a payment button that doesn't respond, can ship while you repair measurement. Experiments that need a small lift detected reliably should wait.
<a id="page-level-checks-for-product-category-and-checkout-pages"></a>
Page-Level Checks for Product, Category and Checkout Pages
Work in the order a shopper does. For each check, write the pass signal before the fix. If you can't state what passing looks like on a real screen, you aren't auditing yet, you're collecting opinions.
<a id="product-and-category-pages"></a>
Product and Category Pages
On product pages, change every variant and watch price, stock, SKU specific messaging, and the sticky buy button. They should update without a reload and without disagreeing with each other. On a 375 pixel wide screen, the add to cart button should be visible without scrolling past reviews or an oversized gallery. Delivery timing, returns, and any threshold for free shipping belong near the buy action, not only in the footer.
Score the template against usability heuristics while you're there. Check visibility of system status when an item is added, error prevention on unavailable variants, and consistency of price and rating placement across templates. Log a heuristic violation as a finding only when you can name the page, element, and shopper task it blocks.
On category pages, apply two filters, sort, open a product, and return. You shouldn't lose scroll position, active filters, or result counts. Every product card should show price, rating where you have credible review volume, and swatches consistently, with crops that don't cut off the product. A clear all control matters more than another filter group shoppers rarely use.
| Page | Check | Pass signal | Common fix |
|---|---|---|---|
| Product page | Variant and price clarity | Price and stock update on each variant change | Show unavailable variants as disabled, not hidden |
| Product page | Add to cart visibility | Button visible without scrolling on a 375-pixel screen | Make the button sticky on mobile |
| Category page | Filter and sort behaviour | Filters apply without losing scroll position | Show active filters and a clear all control |
| Category page | Product card content | Price, rating and swatches on every card | Standardize image crop and card height |
| Cart | Shipping and total cost | Estimated shipping and tax shown before checkout | Move the shipping estimate into the cart drawer |
| Checkout | Form field count | Default path within the 12 to 14 field ideal range | Hide optional fields and support autofill |
| Checkout | Guest checkout and sign in | Guest path visible on the first screen | Remove forced account creation |
| Checkout | Error recovery | Error names the field and keeps entered data | Use inline validation on blur |
<a id="cart-and-checkout-pages"></a>
Cart and Checkout Pages
In the cart, add items, change quantities, and apply a promo code. The total should stay understandable, estimated shipping and tax should appear before checkout, and an upsell or expanded promo field shouldn't push the checkout button off screen. Surprise costs discovered late are a disclosure failure on the cart and product page, not only a checkout problem.
At checkout, count visible fields on the default path, including optional ones and fields revealed after address entry. Confirm a guest path on the first screen, address autofill, and express wallets and local payment methods for each market you sell in. Enter a bad card number and an incomplete postcode on purpose. Errors should name the exact field, appear where the shopper is looking, and preserve everything already entered.
Audit B2B accounts on their own path when login is required. Time reorder, quote request, approval, and payment on terms separately from DTC checkout, because forcing wholesale buyers through a retail flow creates losses your blended funnel won't explain. Complex B2B, Markets, and checkout extensibility requirements are where teams often need specialist platform work, and our guide to choosing a Shopify Plus agency sets out what to verify before you commit.
For every failed check, record four things. Page, exact element, expected pass signal, and one concrete fix. "Improve checkout UX" is not a fix. "Move the shipping estimate into the cart drawer above the subtotal" is.
<a id="mobile-and-accessibility-problems-that-cost-sales"></a>
Mobile and Accessibility Problems That Cost Sales
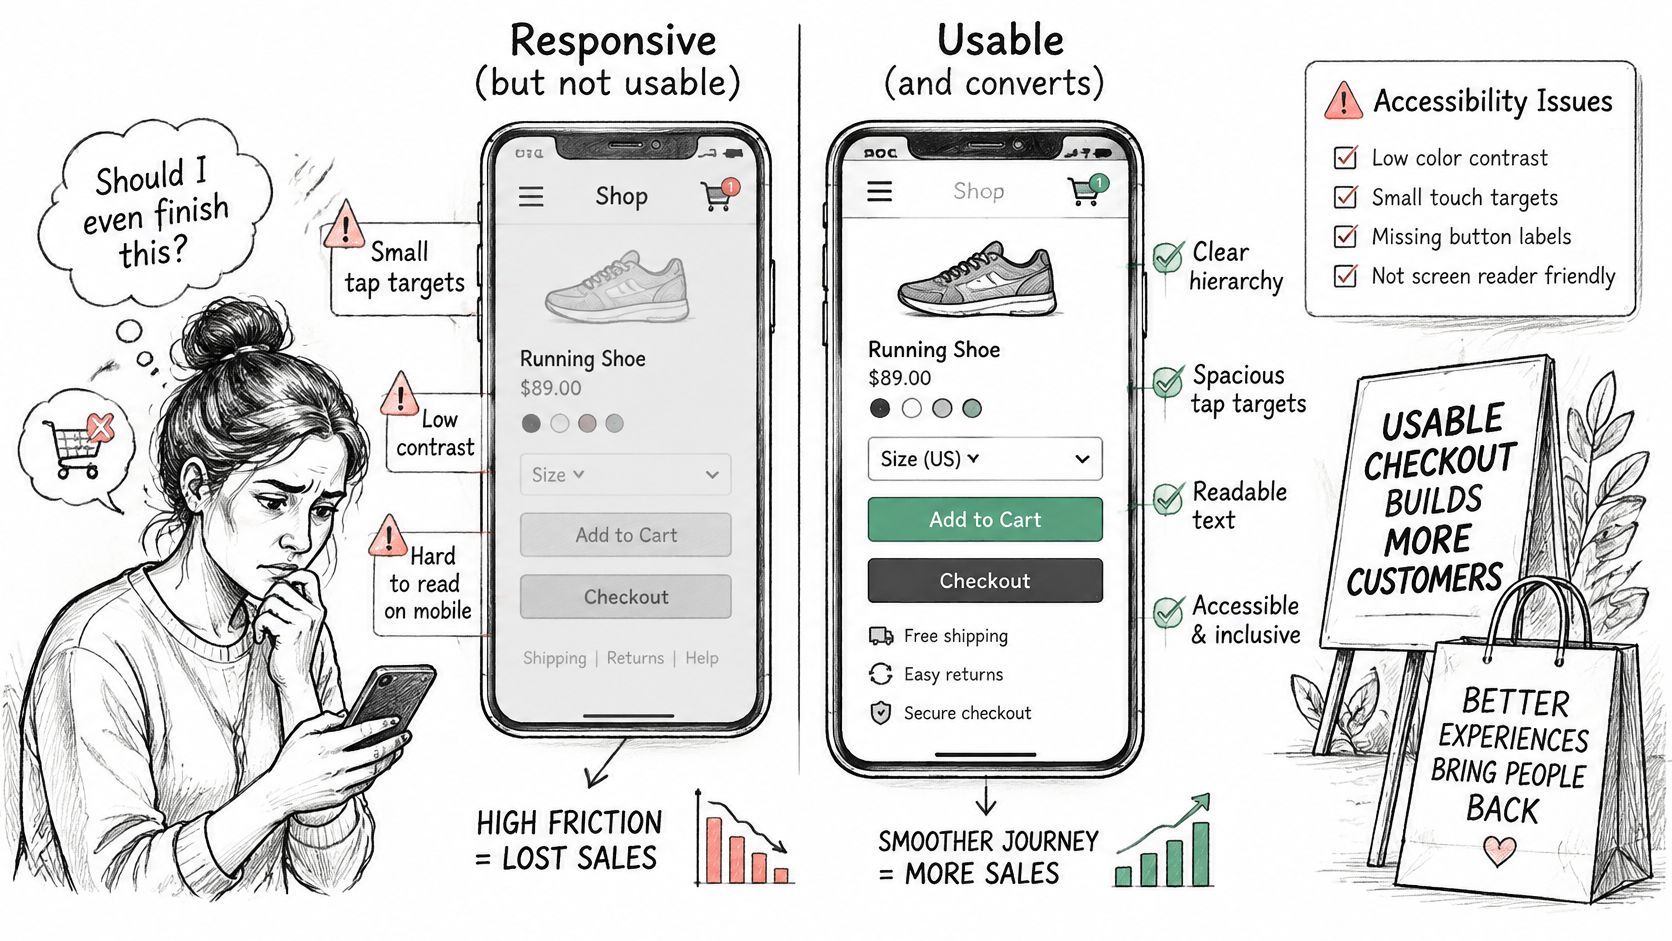
A mobile checkout can look correct on screen and still block a purchase. Inaccessible controls and poorly built mobile flows can cause measurable losses at multiple funnel stages, so test whether shoppers can complete the journey, not just whether the layout adapts.
<a id="tests-to-run-on-real-devices"></a>
Tests to Run on Real Devices
Complete the purchase flow using only a keyboard. Tab order should follow the visual order, every interactive element needs a visible focus indicator, and shoppers should be able to exit drawers, modals, and date pickers. Repeat the key steps with a screen reader. Check that it announces field names, required status, and errors where shoppers can act on them.
- Labels: Give each field a persistent visible label. Placeholder text alone disappears during entry and can leave shoppers unsure what to enter.
- Contrast and errors: Keep button, helper, and error text readable at normal brightness. Identify errors with text or an icon, not colour alone.
- Tap targets: Make controls at least 44 pixels and space them so quantity and remove actions are easy to distinguish.
- Sticky actions: Check that a sticky buy bar does not cover the active field, its error message, or the payment button.
- Autofill and wallets: Test address autofill, Shop Pay, Apple Pay, and Google Pay on current iOS and Android devices in each market.
Repeat the mobile flow on a throttled 4G connection. Heavy app scripts, oversized gallery images, and late-loading payment options can stall a journey that appears fast on office Wi-Fi. Test on a physical mid-range phone as well as in browser tools. Emulators can misrepresent thumb reach, keyboard overlap, and the usable space after browser controls appear.
Connect each defect to a funnel stage and a likely effect. An unlabeled card field can prevent assistive technology users from completing payment and interfere with browser autofill for other shoppers. A focus trap in the cart drawer can stop keyboard users before checkout begins. That deserves more attention than a contrast issue on a low-traffic content page.
For every defect, record the device model, operating system, assistive technology, funnel step, and exact failure. “Mobile checkout needs improvement” gives a developer nothing to reproduce. “The screen reader does not announce the payment field label” identifies a testable problem and a place to start.
<a id="prioritize-fixes-and-validate-them"></a>
Prioritize Fixes and Validate Them
Don't let the loudest stakeholder rank the backlog. Score every logged finding from 1 to 10 on impact, confidence, and ease, then multiply the three scores. The arithmetic is simple on purpose. It forces a conversation about evidence and cost before anyone commits sprint time.
| Criterion | Question to ask | Scale |
|---|---|---|
| Impact | How many shoppers or orders does this touch each month? | 10 = whole checkout or top traffic template |
| Confidence | How strongly do data, recordings and sessions agree? | 10 = analytics and five sessions agree |
| Ease | How many days of development and QA does it need? | 10 = a setting or copy change under one day |
Say your checkout shows 23 visible fields and you can reduce the default path to 13 by hiding optional fields and fixing autofill. That's high impact because it touches every buyer, high confidence if step abandonment, recordings, and moderated sessions all point to form fatigue, and medium ease if checkout settings and QA across markets are involved. It should outrank a homepage headline swap supported by one opinion.
Validate top items with an A/B test where traffic can support a clean read, or a staged release where it can't. Monitor for at least two full purchase cycles, including weekends and your normal promotional rhythm. Watch the primary outcome and the guardrails together, net revenue per session, refund rate, cancellation rate, and margin.
Stop or revert a change that lifts conversion while lowering margin or raising refunds. Record the date, segment, result, and decision in the audit file, then rescore the same path after release so the next audit starts from evidence rather than memory. Teams comparing implementation partners for this stage can use our overview of Shopify Plus developers to check who can ship and measure the work.
In one case, United Victory Technologies migrated a Home & Living retailer with 20k+ SKUs from Magento 2 to Shopify Plus, achieving a 34% increase in conversion rate, 1.8s mobile LCP, and 98% organic retention. That scale of result comes from sequencing, protect the data first, remove the largest friction, then measure. If you'd rather not run the sequence yourself, United Victory Technologies offers a free Store Audit for stores already on Shopify.
Run your leak map this week, reconcile the orders behind it, and score the fixes before you touch the theme. If you want an outside team to audit your funnel, analytics, product pages, and checkout and hand you a ranked backlog you can act on, visit United Victory Technologies and request your free Store Audit.